Issue #170 - Data and Parameter Scaling Laws for Neural Machine Translation

Introduction
The successful training of modern Neural Network models, such as Transformer models (Vaswani et al., 2017), is sometimes surprisingly difficult. The many hyperparameter choices, along with the long training times warranted by the large size of models and data, has often resulted in unexpectedly poor results. In 2020, the OpenAI Group published Scaling Laws for Neural Language Models (Kaplan et al., 2020), an extensive analysis on the training of very large transformer language models. In it they hypothesized formulas relating training loss (L) to compute time (C), dataset size (D), and model size (N), and were able to make surprisingly accurate predictions relating to these factors. However, their work only covered language models, not encoder-decoder models such as those used in Neural Machine Translation (NMT). In today’s post, we will look at the work that Gordon, Duh, and Kaplan have taken as a first step in this direction in Data and Parameter Scaling Laws for Neural Machine Translation, presented at EMNLP 2021, which experimentally finds the same kinds of relationships and limits for NMT models.
Background: Scaling Laws for Language Models
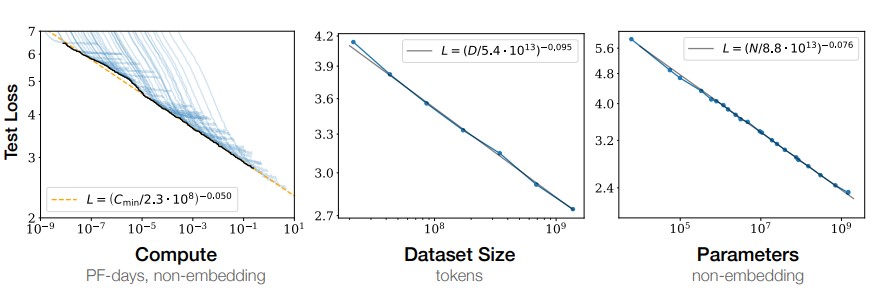
Kaplan et al. (2020) found that the predictive ability of large neural language models has a power law relationship with each of compute (C), dataset size (D), and model size (N), when not bottlenecked by the other two (i.e., all three need to be increased in tandem). The graphs in the figure below show this relationship between prediction ability (measured as “loss”) and these other factors:
 The straight lines in the graph show a linear relationship—the power law is shown by the exponential values on the axes. In the leftmost graph, showing loss vs. compute time, there are many curves being shown in blue, and the black line is the collected inflection points along each curve. This inflection point happens where the decrease in the loss begins to slow down in relation to more computation. These inflection points correlate well with the power law relationship L=(Cmin/2.3·108)-0.05, represented by the orange dashed line.
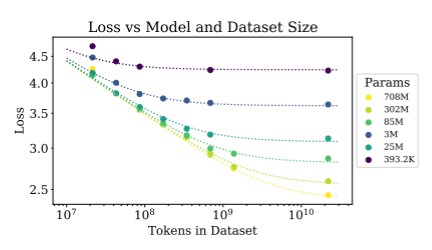
The above graphs in the middle and right plot similar power law relationship of loss vs. dataset size and loss vs. model size (number of parameters), when the other factors aren’t limiting. But these power law relationships disappear when models are limited by another factor. The graph below plots loss vs. dataset size and parameters when we let each of those factors vary independently (the dots show these empirical points).
 Now we see a more complex relationship. Nevertheless, it can be predicted by careful combining of the power laws, as seen in the formula below, with the constants shown on the right. This prediction is shown in the dotted lines.
 This is a remarkable result. Given the relevant constants, we can predict the quality improvement of a sufficiently trained language model based on the model size and the amount of training data. Another corollary: as we increase the size of our training data, we also need to increase the size of the model to maximize the predictive ability of the model, and vice versa.
Scaling for Machine Translation
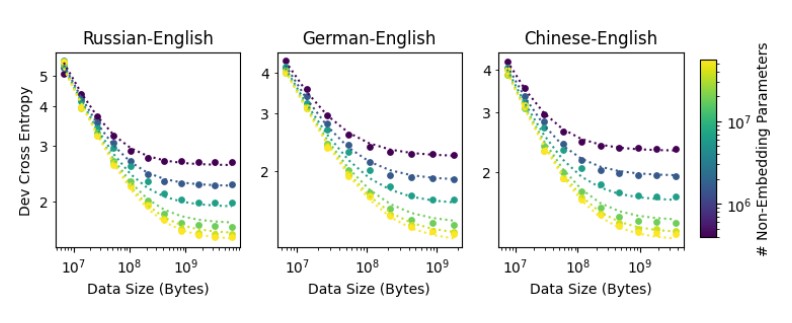
Gordon et al. (2021) show that the same principle applies to machine translation. Neural Machine Translation quality (measured in cross-entropy loss) has a power law relationship with both model size and data size. There is a similarity that can be seen in the graphs below with the graph above.
 The same formula can be used to predict this relationship, but with different (language pair dependent) constants:
 Note that model size (N) has a larger impact on quality than data size (D).
Cross entropy loss is not the usual metric for measuring MT quality, so the authors consider how BLEU, a standard MT metric, correlates with loss. They find an approximate exponential formula relating BLEU and loss (the best fit is when BLEU > 15):
 Note again the points are empirical measurements of BLEU and cross entropy on the same development dataset. While the relationship is exponential in all cases, the constants vary per language pair (left graph) and even with hyperparameter settings on the same language pair (right graph).
Predicting Cost and Benefit of Data Annotation
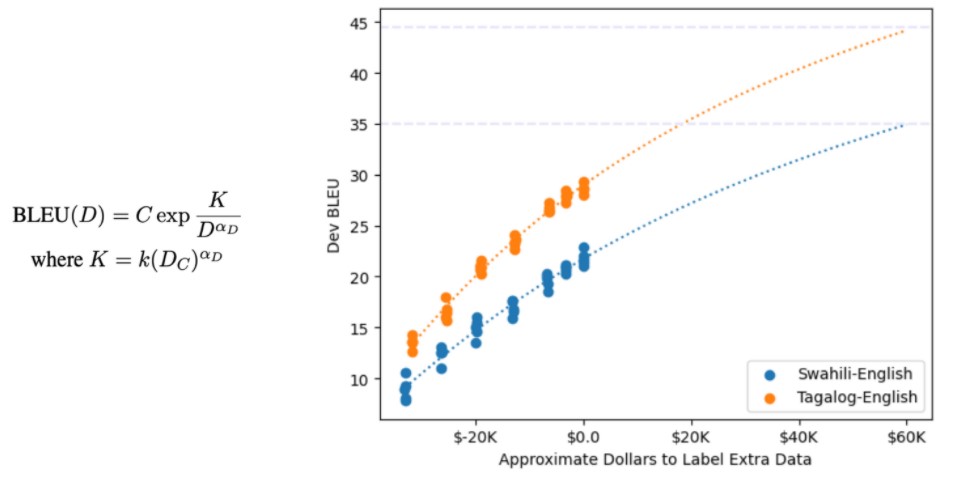
Now that we can relate MT quality in terms of BLEU to factors like dataset size, we can make useful predictions. In Gordon et al. (2021) they demonstrate this with a hypothetical data annotation project. Let’s imagine they want to improve MT quality for a low-resource language. How much money would they need to spend to see an improvement of 10-15 BLEU? Making some assumptions about the cost of translation (in the paper, they assume $10 per kilobyte of training data), they now can combine the relation of BLEU to loss, and loss to data size, and come up with a formula relating BLEU directly to data size (or annotation cost). In the paper they plot this BLEU vs. cost graph based on experiments using different sized subsets of their data:
 Since the x-axis might be confusingly labeled, let me explain. Recall that they assume $10/kilobyte of data, so $0.0 means using all their data and $-20K really means they trained a model using 2MB less data than the total they have available.
Using these preliminary numbers, they can compute the constants and plot curves according to the BLEU vs dataset size formula given on the left. Based on their computations, they predict a 10-15 BLEU improvement will come from a $60K annotation project.
In summary
Gordon et al. (2021) were able to observe and empirically validate that some of the scaling laws noticed earlier by Kaplan et al. (2020) apply equally to Neural Machine Translation. And they were able to use these laws to predict the cost-benefit trade-off of a hypothetical data annotation. This is a useful and practical result.
But the earlier paper also explored many other “scaling laws” which have not yet been applied to Neural Machine Translation. For example, the compute power law implies that the loss value for longer training is predictable, and in fact, predicts that convergence of the model slows down after an inflection point (recall the inflection points of the many blue lines in the very first graph). If true for NMT, it implies that these models continue to improve over very long training times, but with progressively diminishing returns. This certainly reflects our experience training Neural Machine Translation models. The earlier paper also provides some guidelines on optimal model sizes for dataset sizes and suggestions on best use of computational resources, both of which merit more exploring. While Gordon et al. (2021) is a great first step, I believe we have much more to learn about how machine translation behaves under different conditions and hyperparameter settings.

